Statistics
Team
Here you get an overview of all the evaluation statistics at team level. Select a team and evaluation type by using the filters on top of the page
Next, you can view the overall results under 'Total' (the total of each category) or you can view the results per category. Here you can also sort the results by total or by the percentage score of the category.
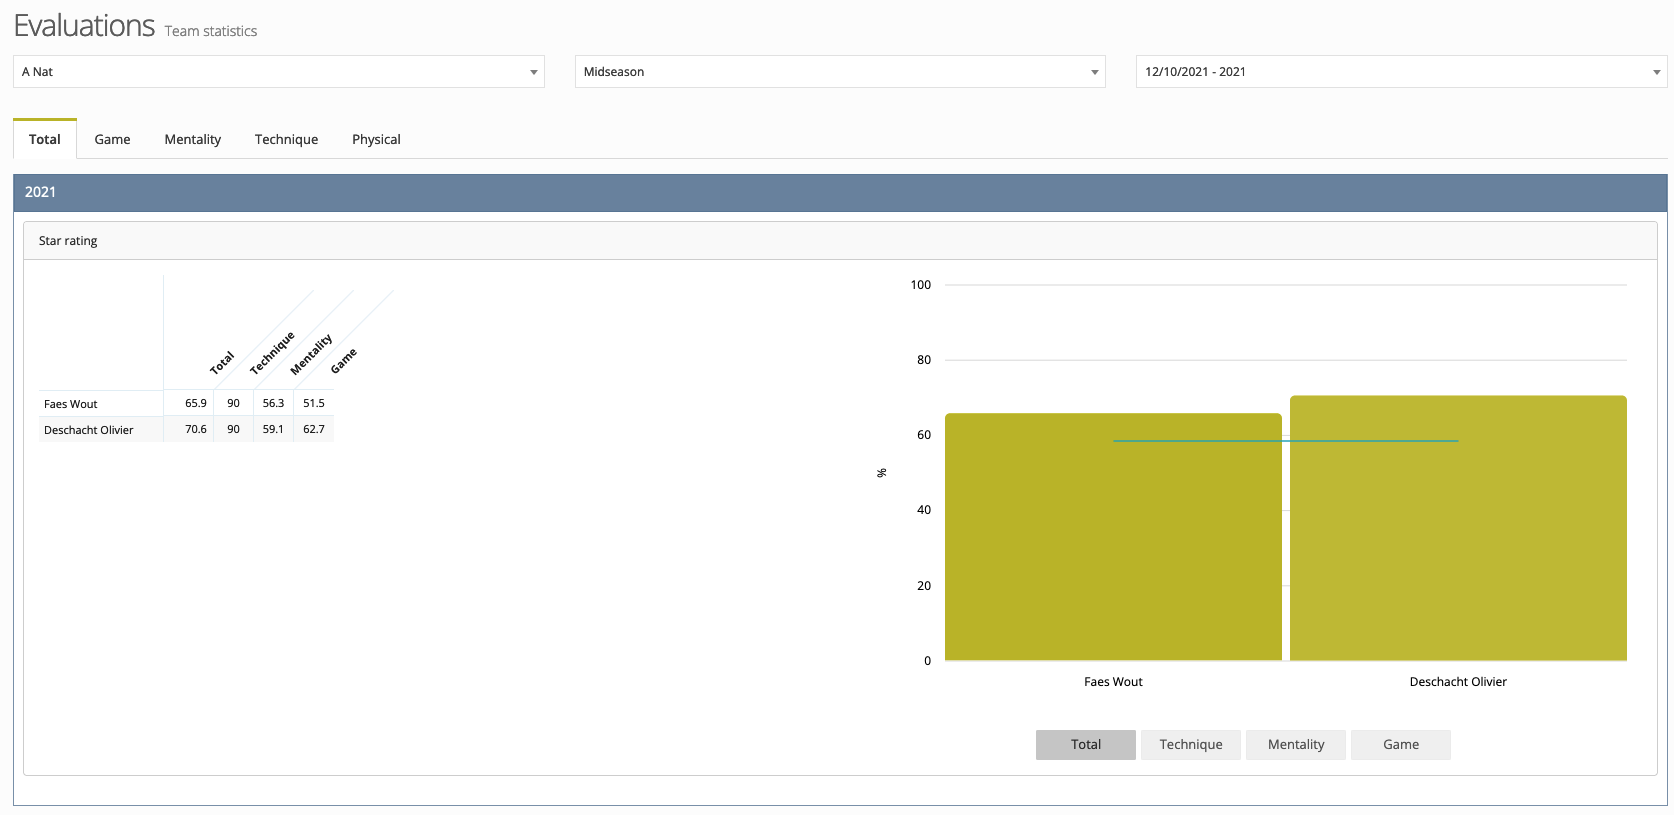
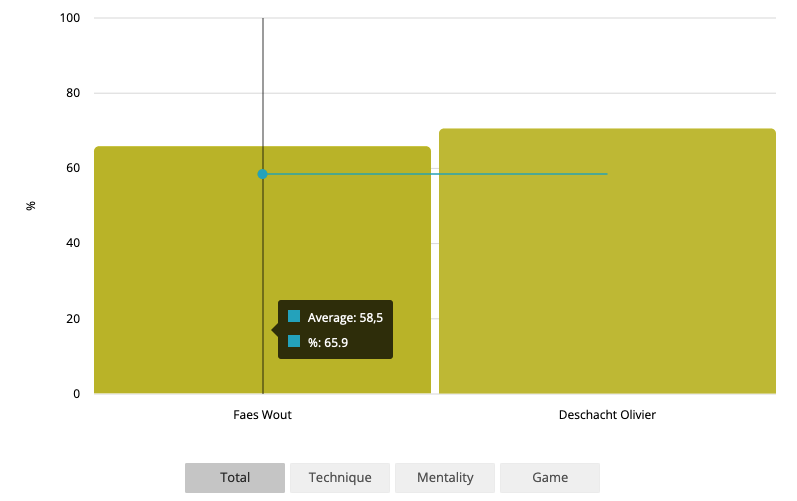
The results are displayed in a graph on the right-hand side. When you hover over it, you can see the average as well as the result per player. At the bottom of the graph you can filter on a category or on specific skills.
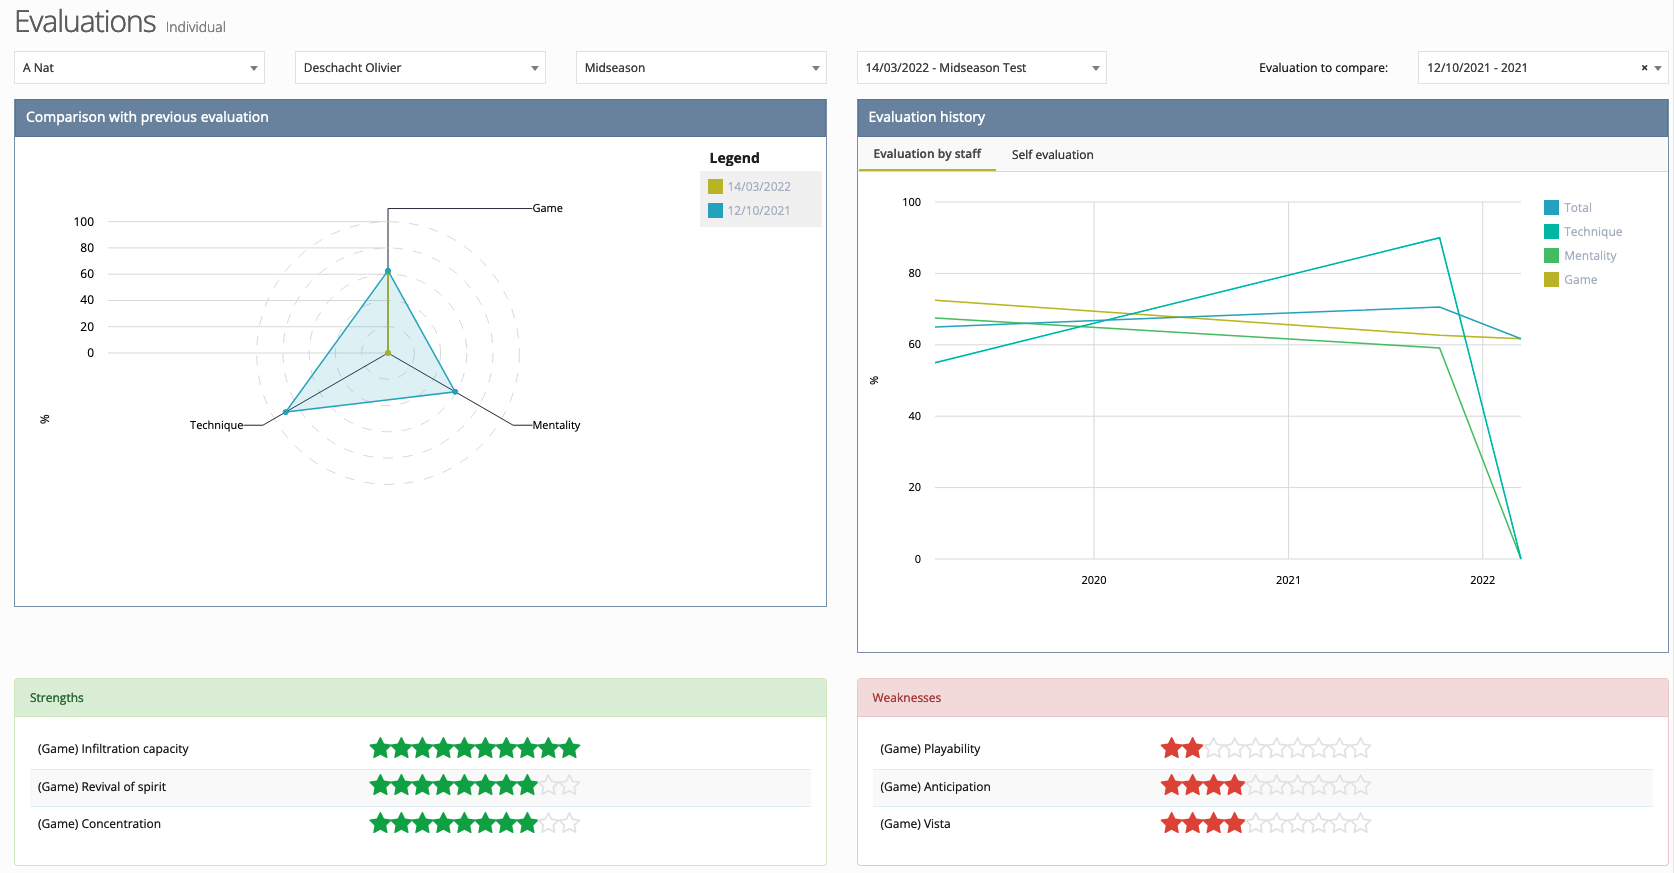
Individual
On this page you get an overview of all evaluation results on an individual level. In the first selectbox you can select either staff or a team depending on whether you want to see the individual statistics of a staff member or a player of a certain team. In addition, choose an evaluation type and 2 submitted forms (default and comparison) to generate the different statistics and graphs.
In the window Comparison with previous evaluation you get to see the results of 2 different evaluations in a radar chart. Hover over the different dots to see this person's result per category.
In the window Evaluation history you get to see the persons' progress over time. Again here you can hover over the dots to see the results per category.
Below these 2 charts you can see the top-3 strenghts and weaknesses of this person. The category of these skills are shown between brackets.
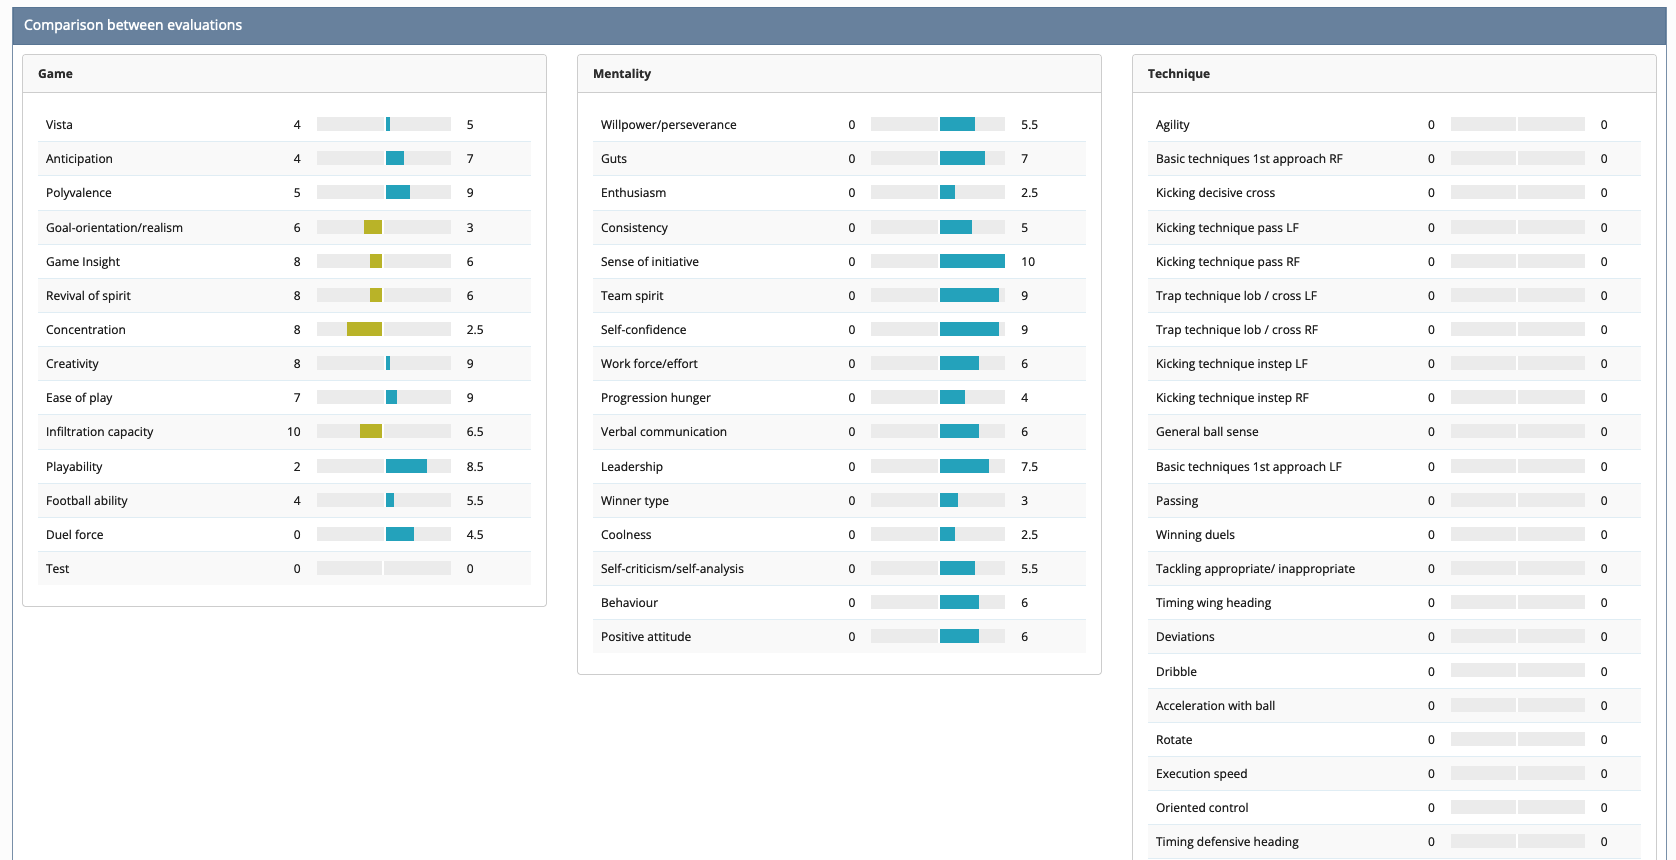
Below the charts there's a window showing a comparison between evaluations. Here you get an overview of all categories and skills of the default evaluation and the one you want to compare with.
On the left side of the score bar you see the score of the default evaluation and on the right side the score of the evaluation you want to compare with. When the score of the default evaluation is higher than the other, the bar will show a yellow zone. Vice versa the bar will show a blue zone.
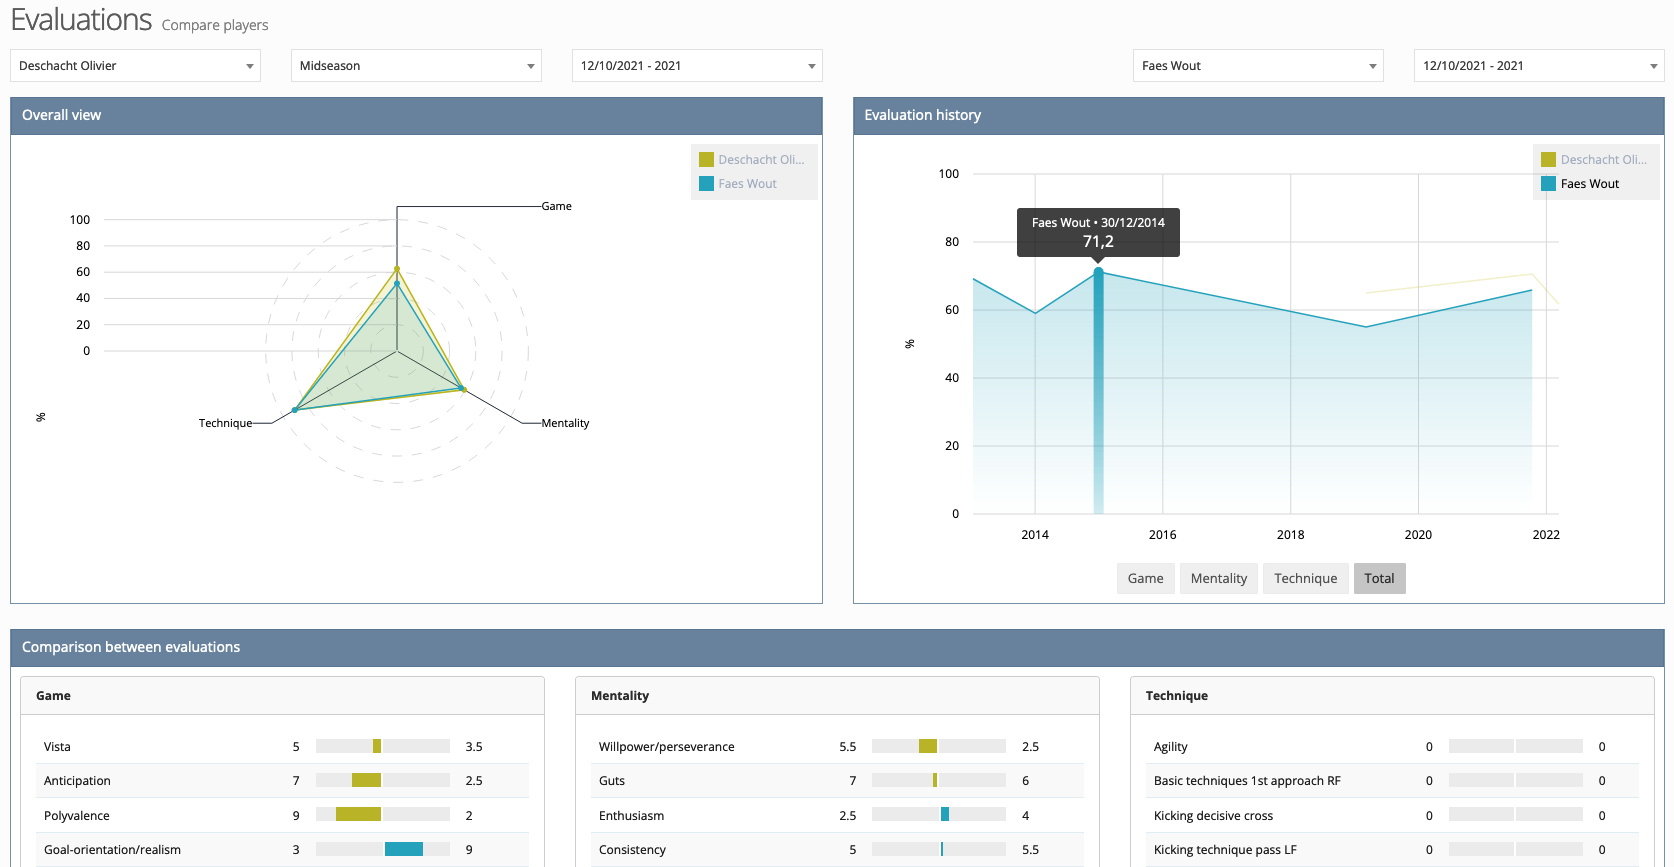
Compare players
On this page you can compare the evaluation of 2 different players with each other. First, select 2 players, the evaluation form type and the evaluation subtype. Once selected, 3 different windows appear:
- Overall view: An overview of the evaluation results per category. Hover over the dots to see the general scores
- Evaluation history: An overview of the results of all evaluations made over time
- Comparison between evaluations: An overview of all skills per category of both players
On the left side of the score bar you see the score of the first selected player and on the right side the score of the other player. When the score of the first player is higher than the other, the bar will show a yellow zone. Vice versa the bar will show a blue zone.
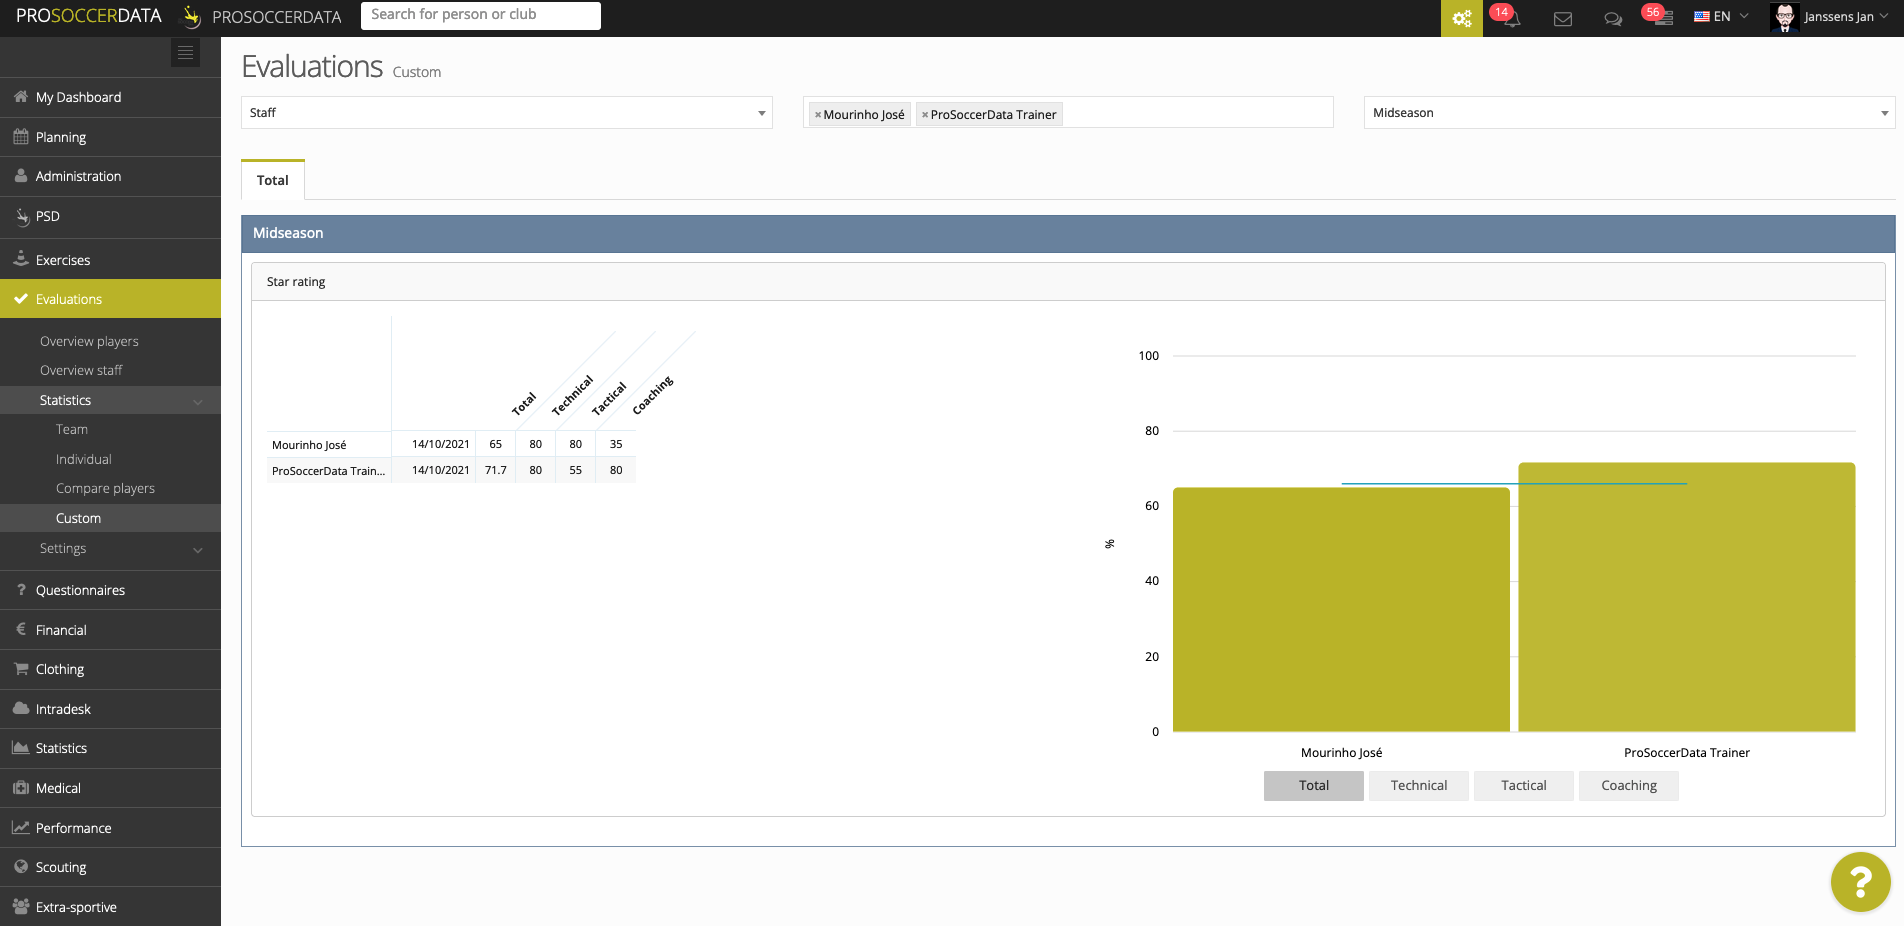
Custom
On this page, in the first select box, you specify for which main type you want to see results: player, goalkeeper, scouting, school or staff. Depending on the chosen main type, you have the following options in the second select box:
- Player: Teams, Groups, Members
- Goalkeeper: Teams, Groups, Members
- Scouting: Players
- School: Groups, Players
- Staff: Teams, Groups, Members
Finally, in the last selectbox you choose the evaluation type to get an overview of the results from the last evaluation for each individual selected. The charts showed on this page are the same as those on the team statistics page.